
B2B Marketing Analytics That Tie to Revenue
· Cole Stark · 7 min read
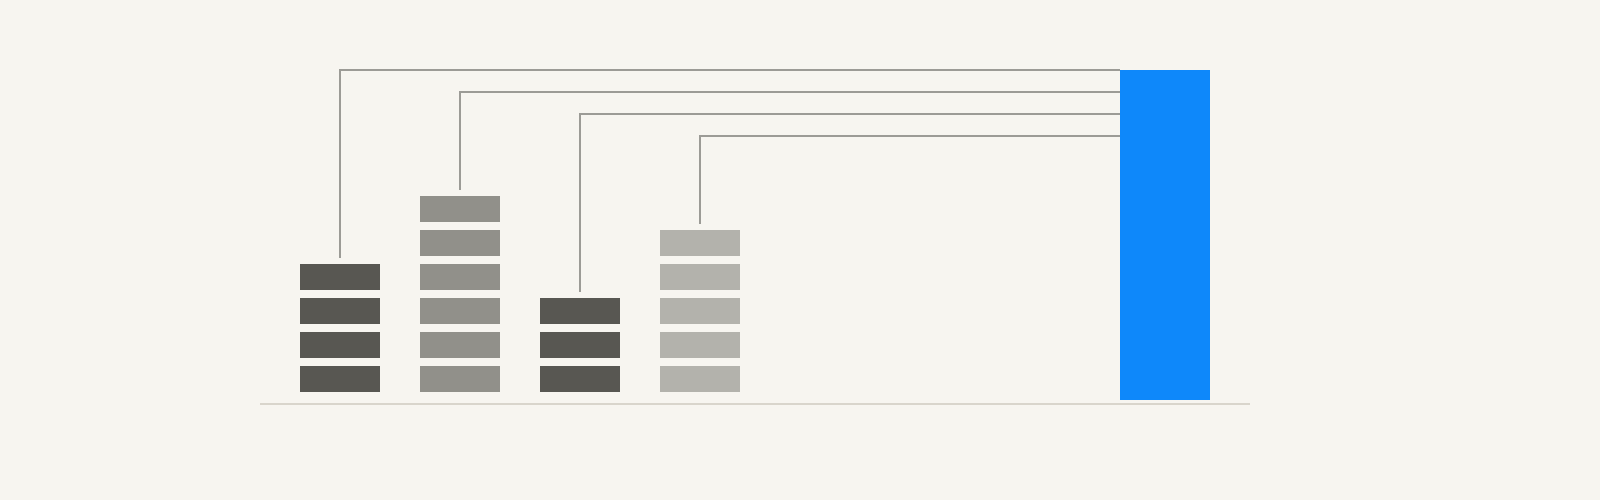
B2B marketing analytics is measuring which marketing produces pipeline and revenue, not just traffic and leads. For a startup, that means joining four sources into one weekly view by channel: ad platforms, web analytics, product data and the CRM. Then add what buyers tell you about how they found you, because much of the journey never shows up in a dashboard.
Most B2B teams have the data. It sits in five tools that disagree with each other. Here's what to join, what to measure, which tools you need and how to report it.
Why B2B marketing analytics is harder
B2B buyers do most of their research before they talk to you. In 6sense's 2025 Buyer Experience Report, a survey of nearly 4,000 B2B buyers, buyers first contacted sellers 61% of the way through their journey. Earlier studies in the same series found buying groups averaging more than ten people.
They also prefer to do it alone. In a Gartner survey of 646 B2B buyers, run in August and September 2025, 67% preferred a buying experience without a sales rep, and 45% had used AI during a recent purchase.
So analytics usually sees the end of the journey: a form fill or a signup from one person at a company where several people did weeks of research. Your setup has to follow accounts and deals, not just sessions. Some influence will only ever show up in what buyers tell you.
The four data sources to join
Each tool sees one slice. The work is joining them on keys they share.
| Source | What it tells you | Joins on |
|---|---|---|
| Ad platforms | Spend, clicks and the conversions they claim | Campaign, UTM tags, click IDs |
| Web analytics and Search Console | Sessions, landing pages, key events, search queries | UTM tags, landing page, user ID |
| Product data | Signups, activation, usage, upgrades | User ID, email, company domain |
| CRM | Leads, opportunities, deal value, closed revenue | Email, company domain |
Add one more field everywhere: the answer to "How did you hear about us?" on the signup or demo form. It's the only source that captures podcasts, communities, AI assistants and word of mouth.
Web analytics and Search Console disagree with each other too, which I explain in Google Search Console vs Google Analytics.
At Quadratic, I built this join across Mixpanel, Postgres, GA4, Search Console, the CRM and the ad platforms. The point wasn't the dashboard. It was that the whole company looked at the same numbers each week.
B2B marketing analytics metrics by stage
Track a few numbers at each stage, by channel. Each stage should explain the next.
| Stage | Metrics | What it tells you |
|---|---|---|
| Demand | Search impressions, branded search volume, share of AI answers | Whether more people are looking for you |
| Acquisition | Signups or leads by source, cost per signup or lead | Which channels bring people in |
| Activation or qualification | Activation rate, qualified-lead rate by source | Which channels bring the right people |
| Pipeline | Opportunities and pipeline value by source | Which channels create sales conversations |
| Revenue | New revenue, CAC and payback by source | Which channels pay back |
The common mistake is stopping at acquisition. Lead counts and cost per lead look fine in a dashboard while the pipeline stays flat. The metrics that matter in B2B marketing analytics are the ones closest to revenue that you can still measure weekly. My guide to B2B marketing KPIs covers which to put in front of leadership.
Build it in this order
- Fix tracking first. Clean events in GA4, UTM tags on every link you control, click IDs stored with each lead, and consent handled properly.
- Store the first-touch source on the contact, the account and the deal in your CRM, using hidden form fields.
- Add the "How did you hear about us?" field to signup and demo forms, and read the answers weekly.
- Join the sources on email and company domain, in a spreadsheet at first and a data warehouse once volume grows.
- Write an attribution policy: which model you report, how you treat brand search, and what counts as marketing-sourced. My guide to marketing attribution models covers the choices.
- Ship one weekly report, and keep its definitions stable.
Tracking is almost always the first fix. If a conversion fires on a page view or counts twice, every number downstream is wrong, and so is every bidding decision based on it.
Track accounts, not just people
Roll contacts up to their company domain so you can see account-level activity. If three people from one company visited pricing this month, that's one buying signal, not three anonymous sessions.
Account-level data is also what account-based marketing runs on: a B2B approach that treats each high-value target account as its own market. You don't need an ABM platform to start. A CRM report of engaged accounts by source is enough to see whether marketing is reaching the right companies.
Tools for B2B marketing data analytics
A startup can do B2B marketing data analytics with a small stack:
- Web analytics: GA4, linked to Search Console.
- Product analytics: an event tool like Mixpanel, Amplitude or PostHog, or queries on your own database.
- CRM: HubSpot or Salesforce, with source fields set up properly.
- A place to join them: a spreadsheet at first, then a warehouse like BigQuery or Postgres with a BI tool on top.
Dedicated B2B attribution platforms can help later, once you run several paid channels at real spend. Before that, they mostly re-chart data you haven't cleaned yet.
What analytics can't see
Some influence never produces a click. A founder hears about you on a podcast, a developer sees a Reddit thread, a buyer asks ChatGPT for options. None of that arrives with a UTM tag.
Two signals fill part of the gap. Self-reported answers name the channels people remember. Branded search volume, compared before and after a launch or a creator campaign, shows whether more people went looking for you. Neither is precise, so treat them as direction, not proof.
When channels can't be measured the same way, compare them on cost per customer where you can, and on direction where you can't. My guide to marketing effectiveness covers how to weigh them.
A weekly B2B marketing report
One page, the same every week:
- New signups or leads, qualified leads, opportunities and new revenue, this week and the four-week trend.
- The same numbers by channel, with brand search reported separately.
- Spend and cost per customer by paid channel.
- Top self-reported sources.
- One paragraph on what changed and what you'll do about it.
The last line matters most. A report that doesn't change a decision is decoration.
B2B marketing analytics should answer one question
B2B marketing analytics earns its keep when it answers where the next dollar should go. Join ad, web, product and CRM data, measure each channel down to pipeline and revenue, ask buyers what the dashboards miss, and report the same way every week. Setting that up is the core of my growth analytics work.
B2B Marketing Analytics FAQs
What is B2B marketing analytics?
B2B marketing analytics is measuring how marketing activity turns into pipeline and revenue for a business that sells to other businesses. It joins ad platform, web analytics, product and CRM data to show which channels bring qualified leads, opportunities and customers, and at what cost, across long sales cycles with several people involved in each deal.
Which metrics matter most in B2B marketing analytics?
The metrics that matter most are qualified leads, opportunities, pipeline value, new revenue and customer acquisition cost, all broken down by channel. Traffic and lead counts are useful early signals, but they can rise while revenue stays flat. Report brand search separately so it doesn't inflate other channels.
What tools do you need for B2B marketing analytics?
You need four kinds of tools: web analytics such as GA4 with Search Console, product analytics or database queries, a CRM with source fields, and somewhere to join the data, from a spreadsheet to a warehouse with a BI tool. Dedicated attribution platforms are optional until paid spend is significant.
How is B2B marketing analytics different from B2C?
B2B analytics differs from B2C because deals take longer, involve several people and close in a CRM rather than a checkout. That means tracking accounts and opportunities instead of single sessions, importing revenue from the CRM, and relying more on self-reported sources, since much of the research happens before anyone contacts sales.
How do you measure marketing with long B2B sales cycles?
You measure marketing with long B2B sales cycles by tracking leading indicators weekly and revenue on the cycle. Record the first-touch source on every contact and deal, report qualified leads and opportunities by channel each week, and judge channels on closed revenue once enough deals have finished. Avoid cutting a channel before one full cycle.